Compressed vs Raw Data Analysis
Tuning exception and compression to instrument precision — less data, full fidelity, faster performance.
Tuning exception and compression to instrument precision — less data, full fidelity, faster performance.
This article shows how to apply proper exception and compression settings to PI tags based on instrument precision. This reduces the amount of data that needs to be stored and processed for trending, analytics, and more — and using compressed data instead of raw data for operational analysis leads to faster performance for applications and end users.
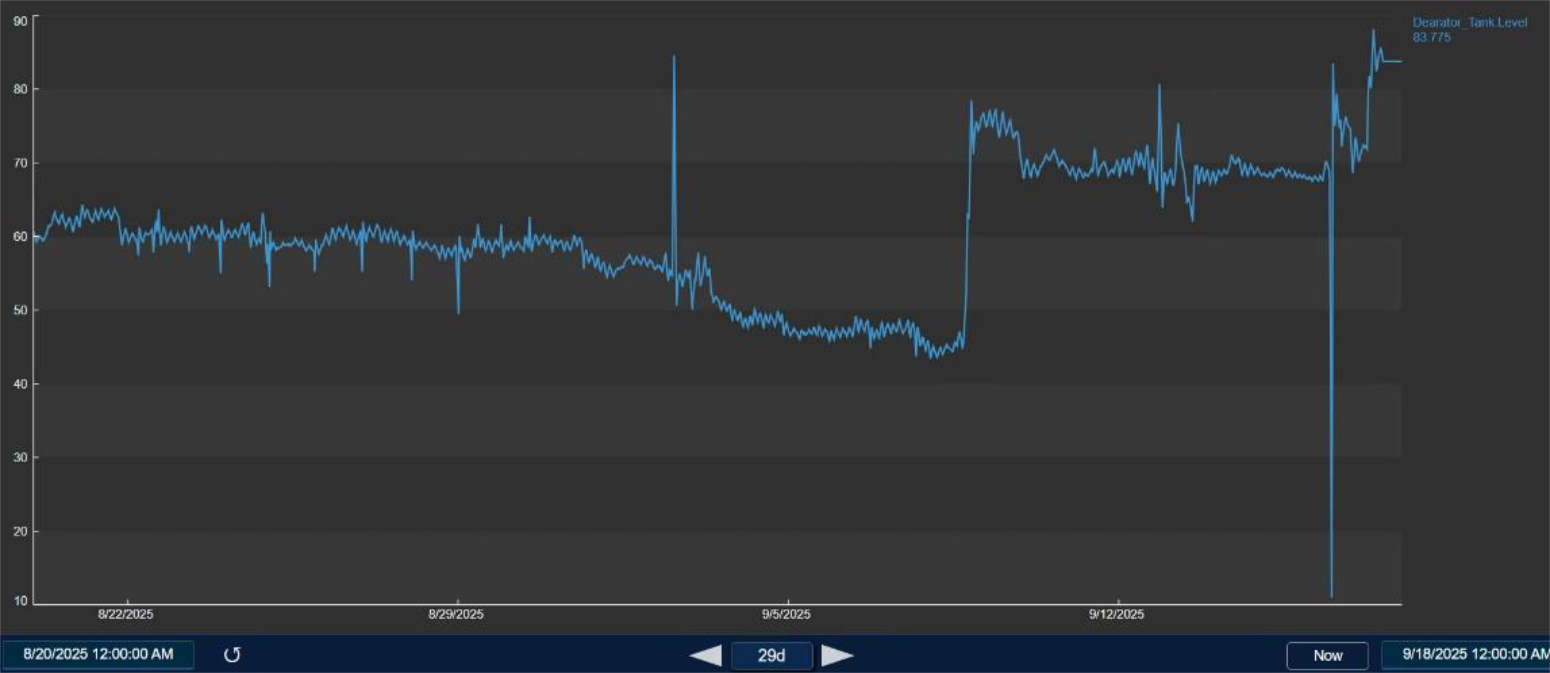
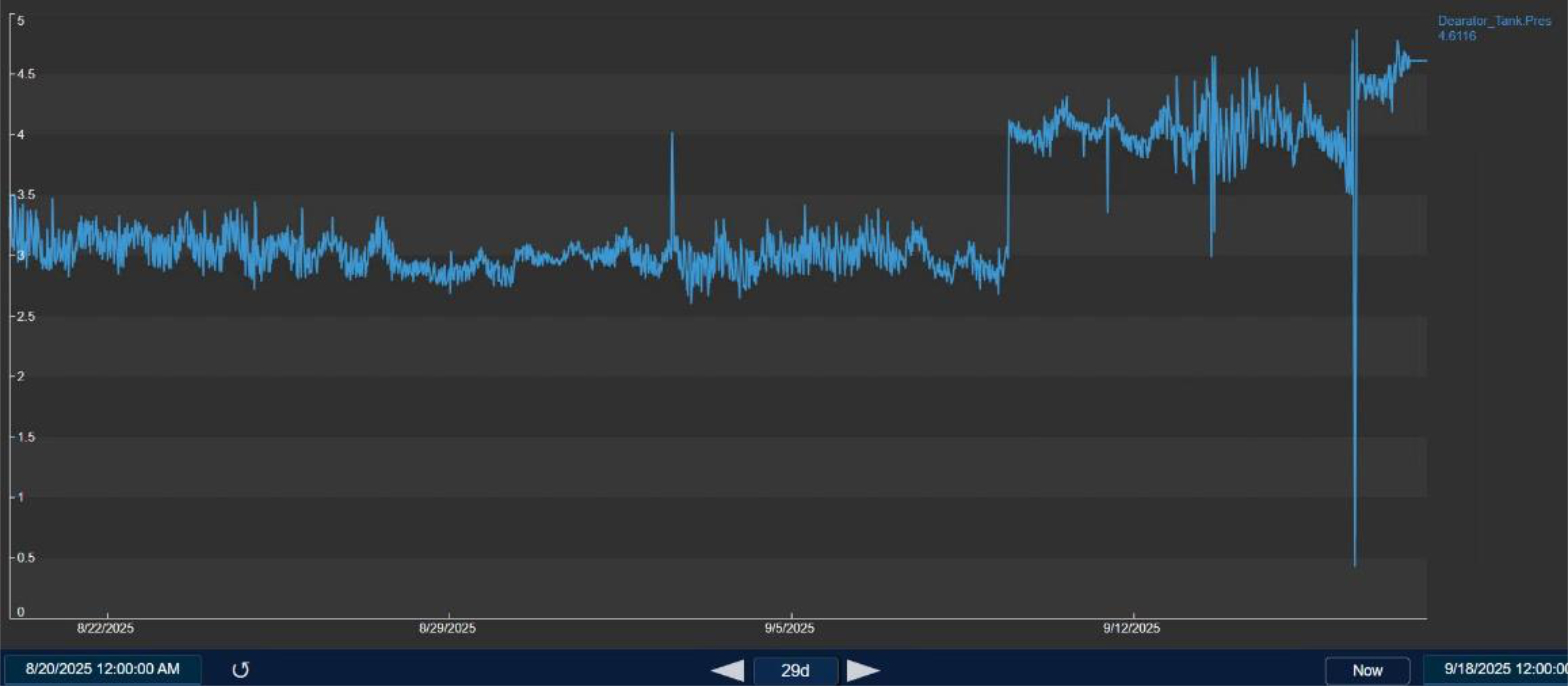
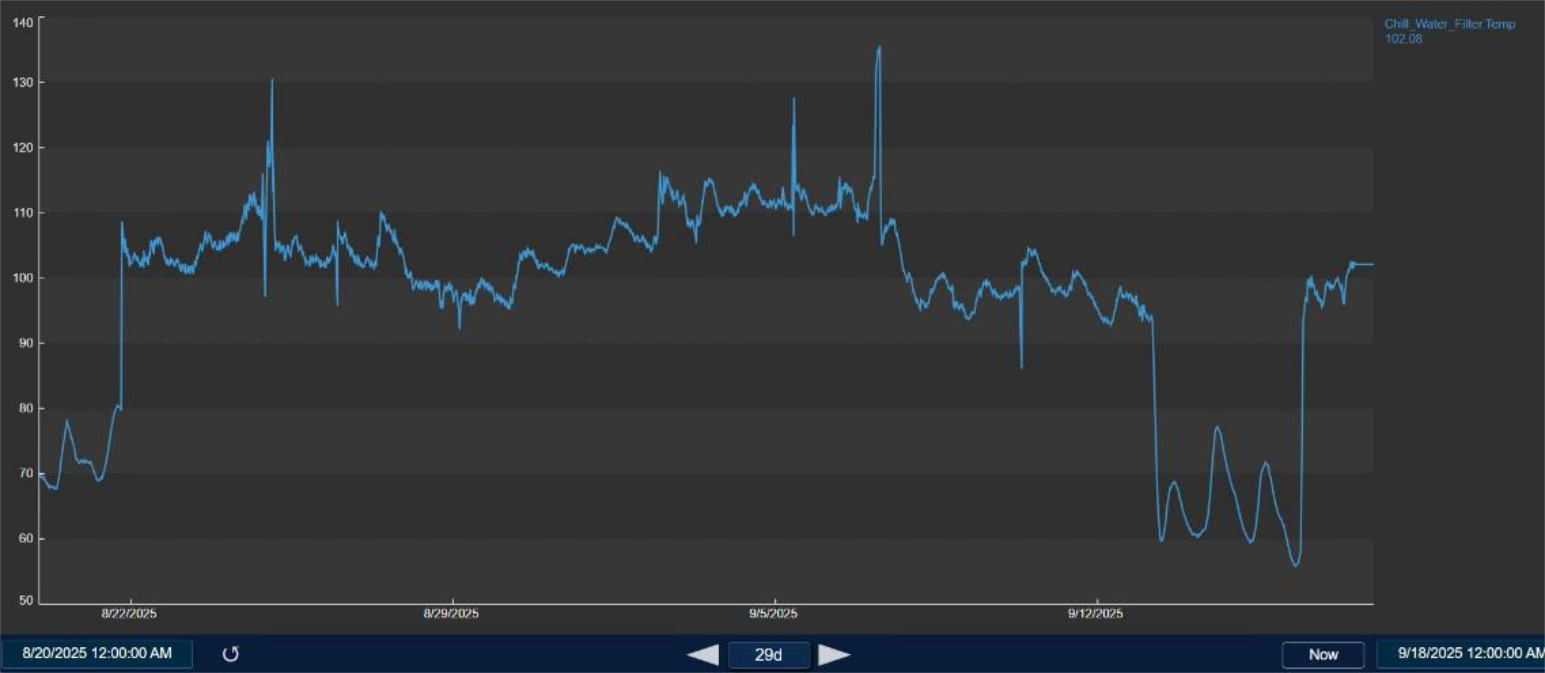
The analysis below was conducted over 29 days using three datasets from a customer's process: tank level, tank pressure, and chill water temperature.
Raw tank level data for 29 days.
Raw tank pressure data for 29 days.
Raw chiller temperature data for 29 days.
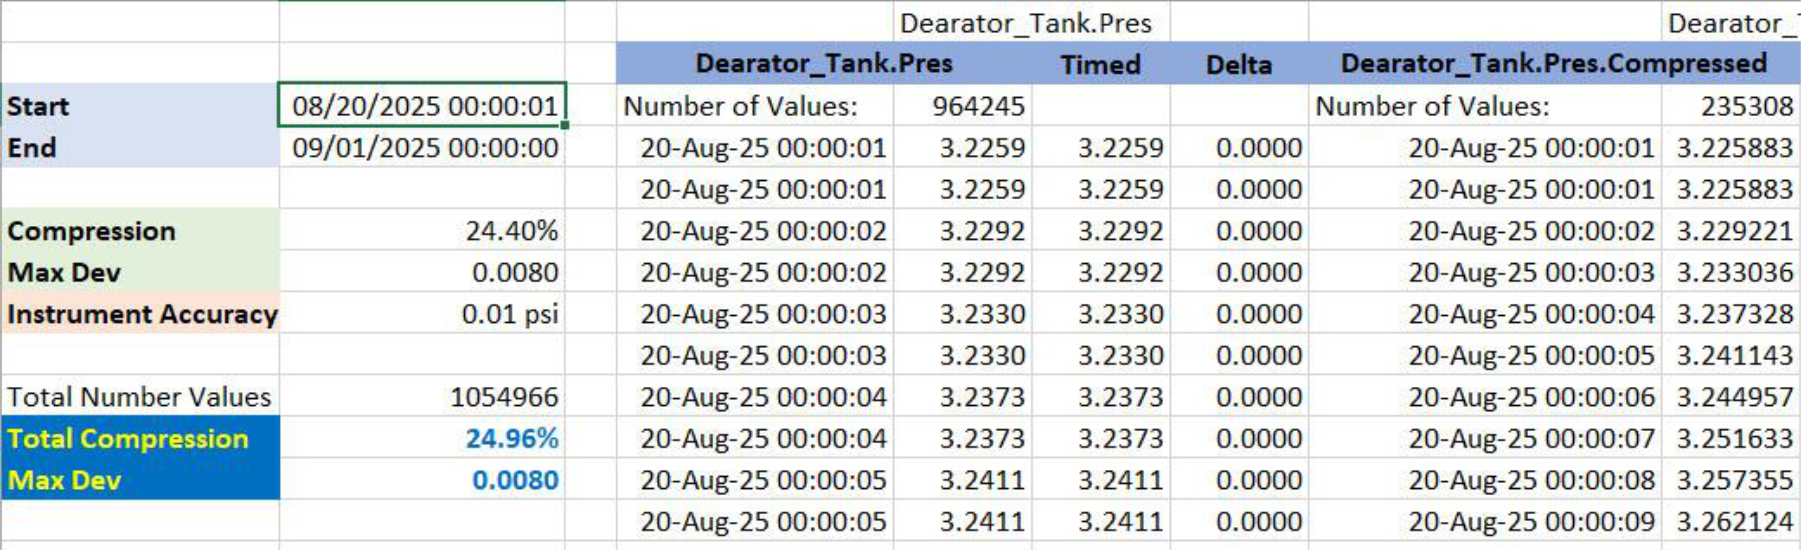
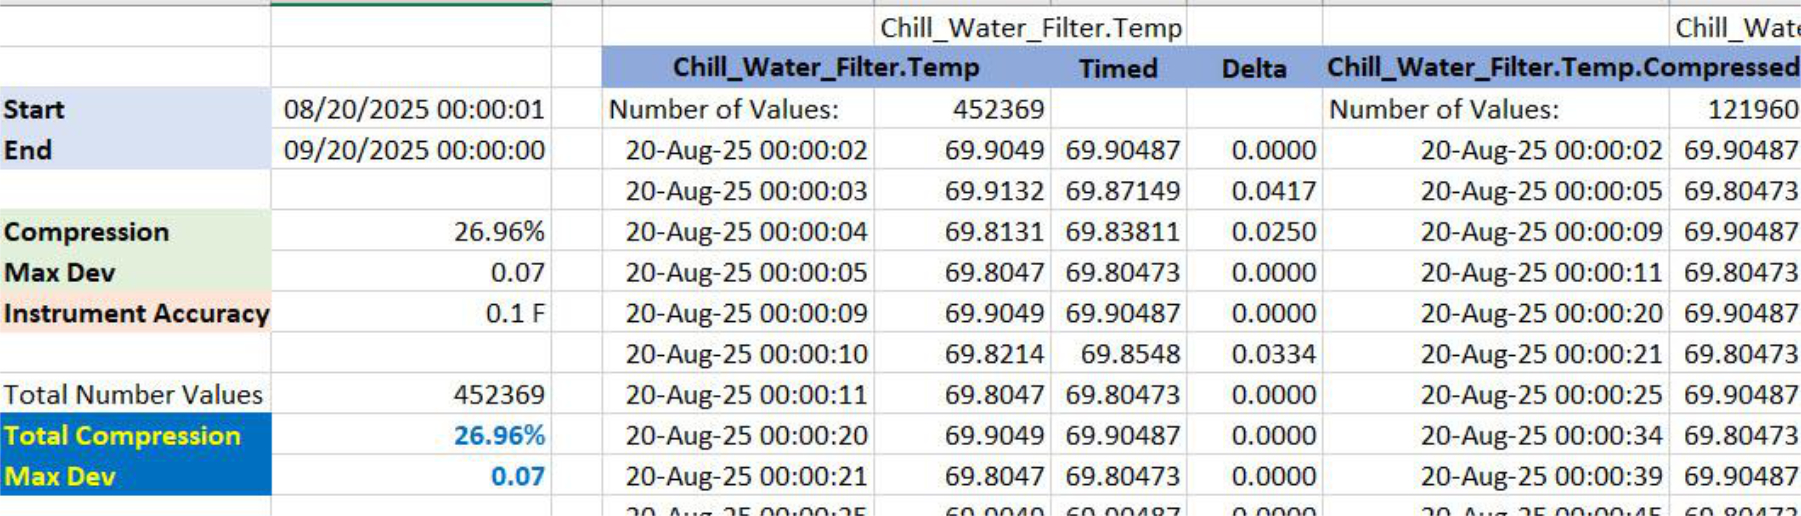
This summary table shows the results of setting the proper exception and compression on each measurement's raw data.
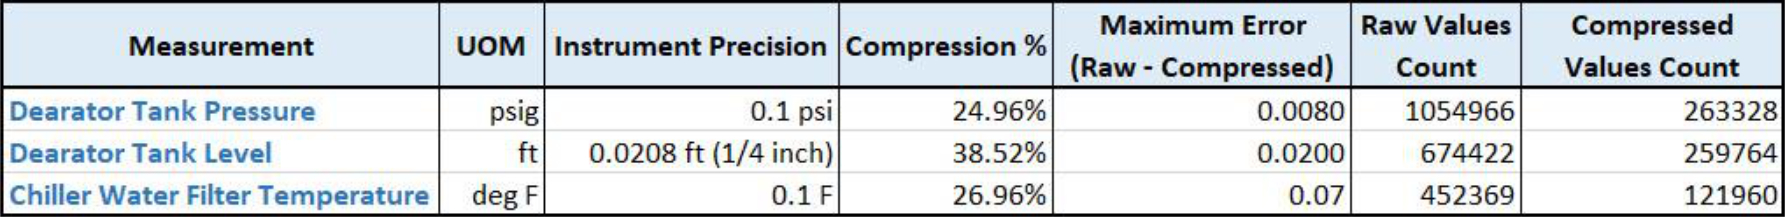
The precision of the measurements was taken from typical industrial instrument specifications. The maximum error (raw value − linear interpolation of compressed values) is below the precision of the instruments. This means the eliminated data was noise that added no benefit to store — the compressed data represents the raw data accurately to the precision of the instruments and does not miss any of the true signals.
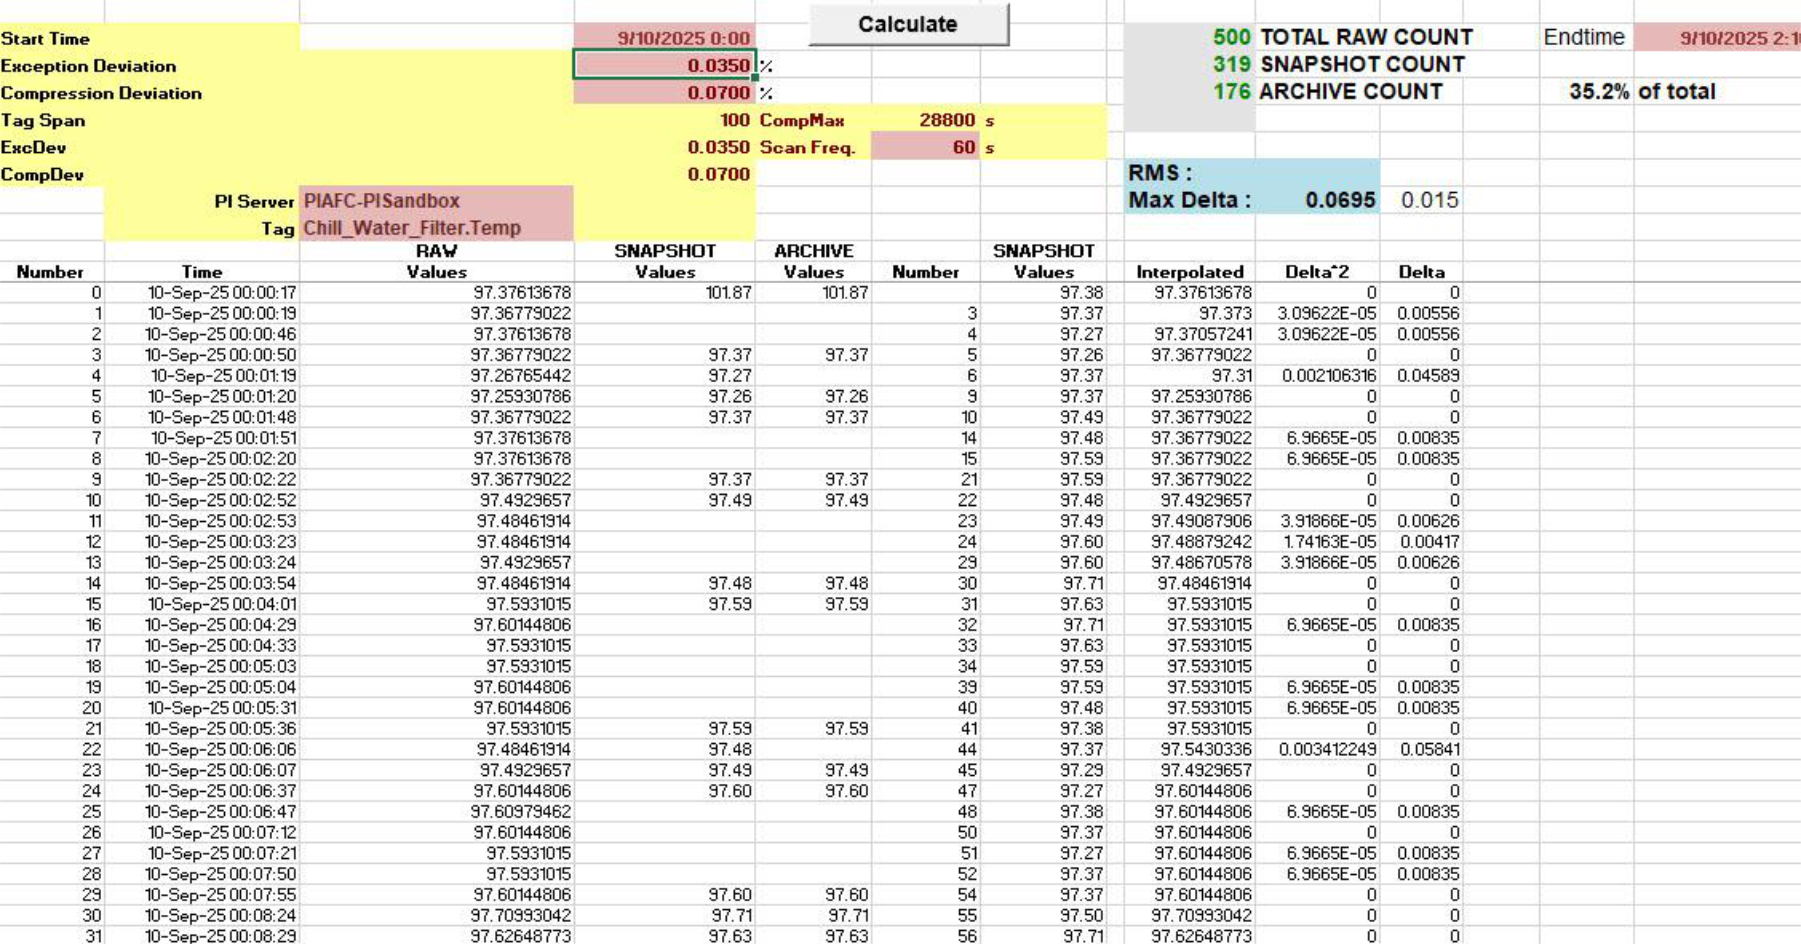
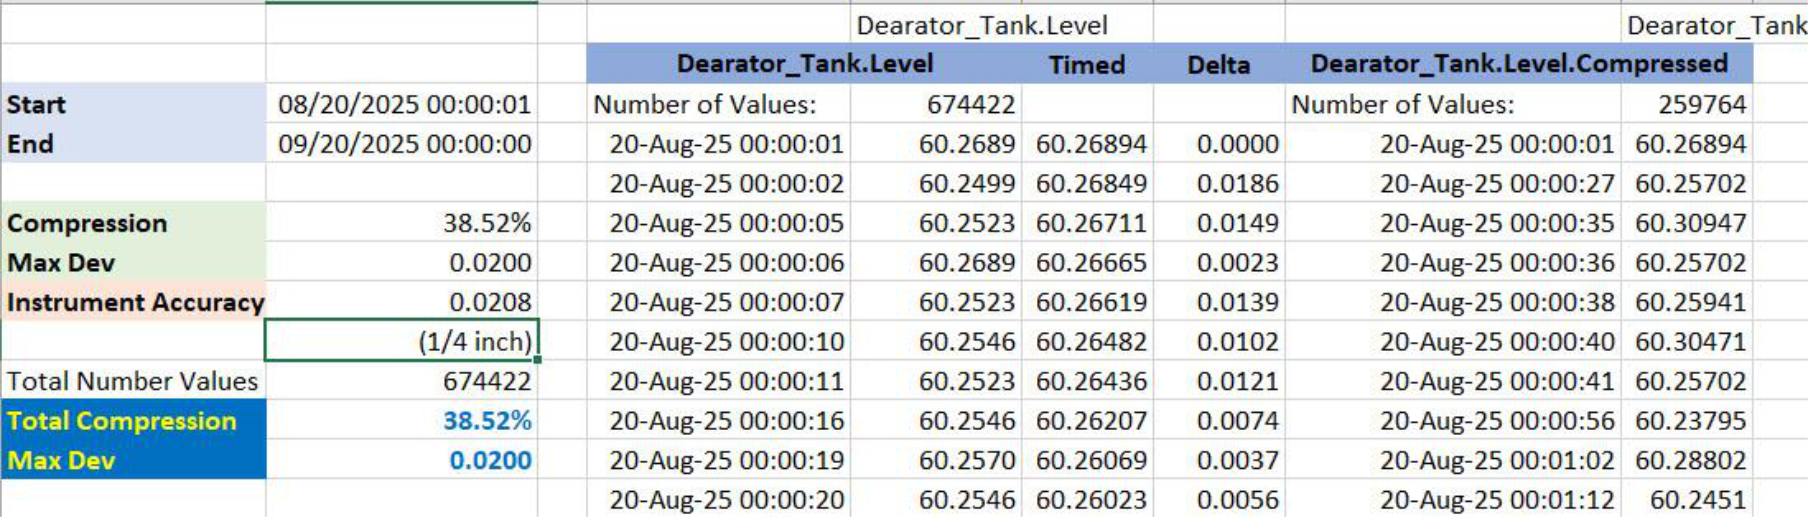
The evaluation used a tag tuning spreadsheet that mimics the PI System compression and exception behavior. The settings for each tag were tested so that the maximum difference between the original raw value and the interpolated compressed value is less than the precision/repeatability of the instrument. Here is an example of the tag tuning spreadsheet.
Comparing the raw data to interpolated values from the compressed data at the same timestamps, the maximum deviation from any raw value was 0.008 psi — well below the instrument precision of 0.01 psi. The resulting compressed data is only 24.4% of the raw data, which means less storage, less bandwidth, and higher performance on trending and AF analytics.
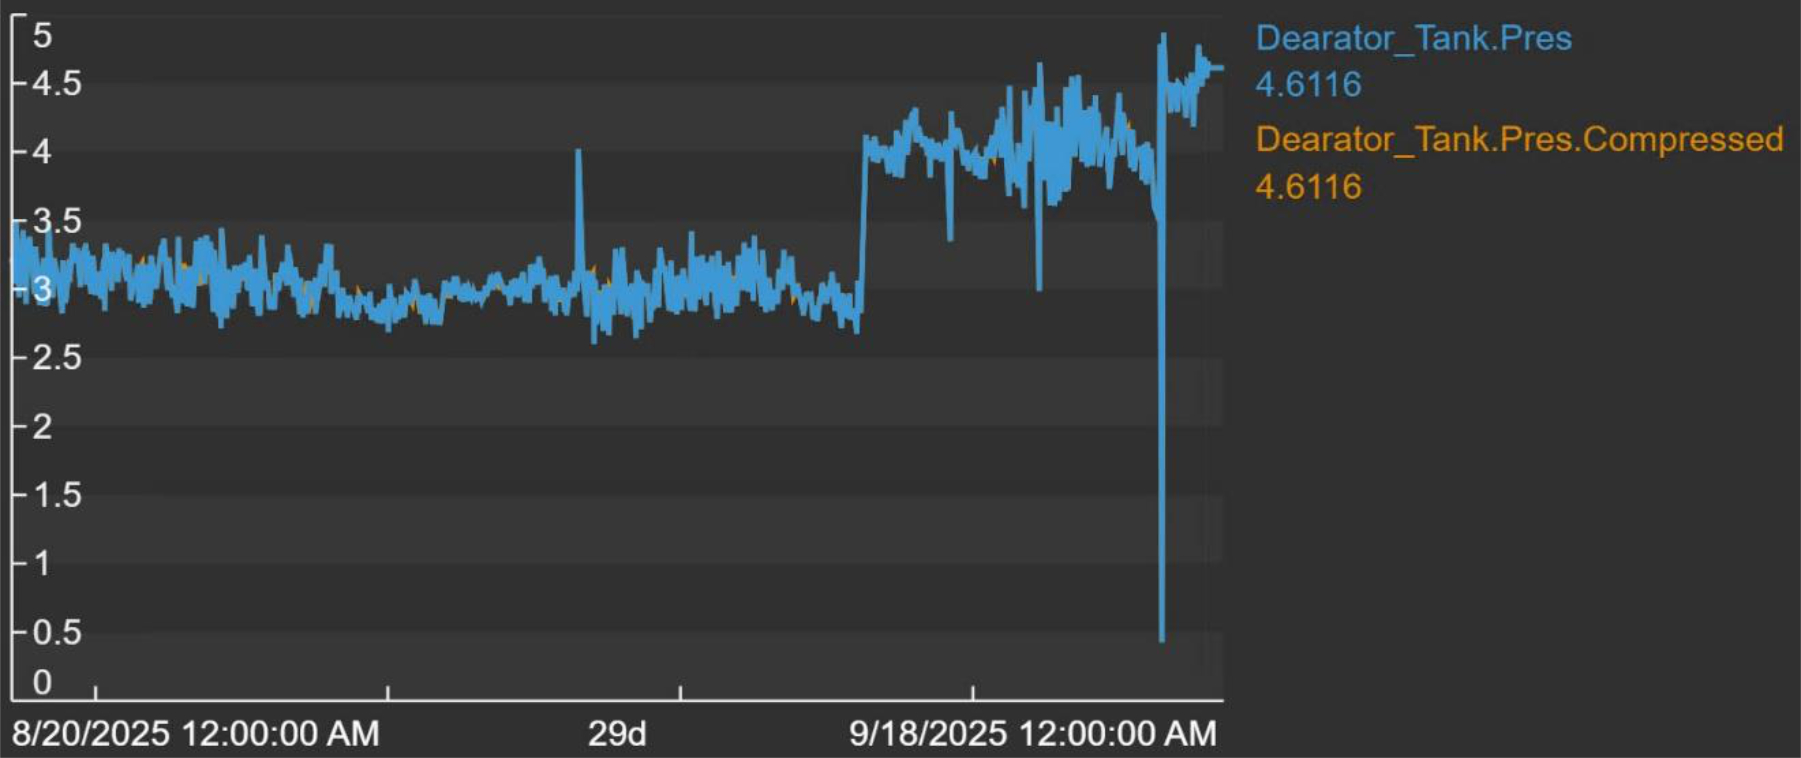
Below is a trend comparing the raw and compressed datasets for the 29-day period. The difference is imperceptible.
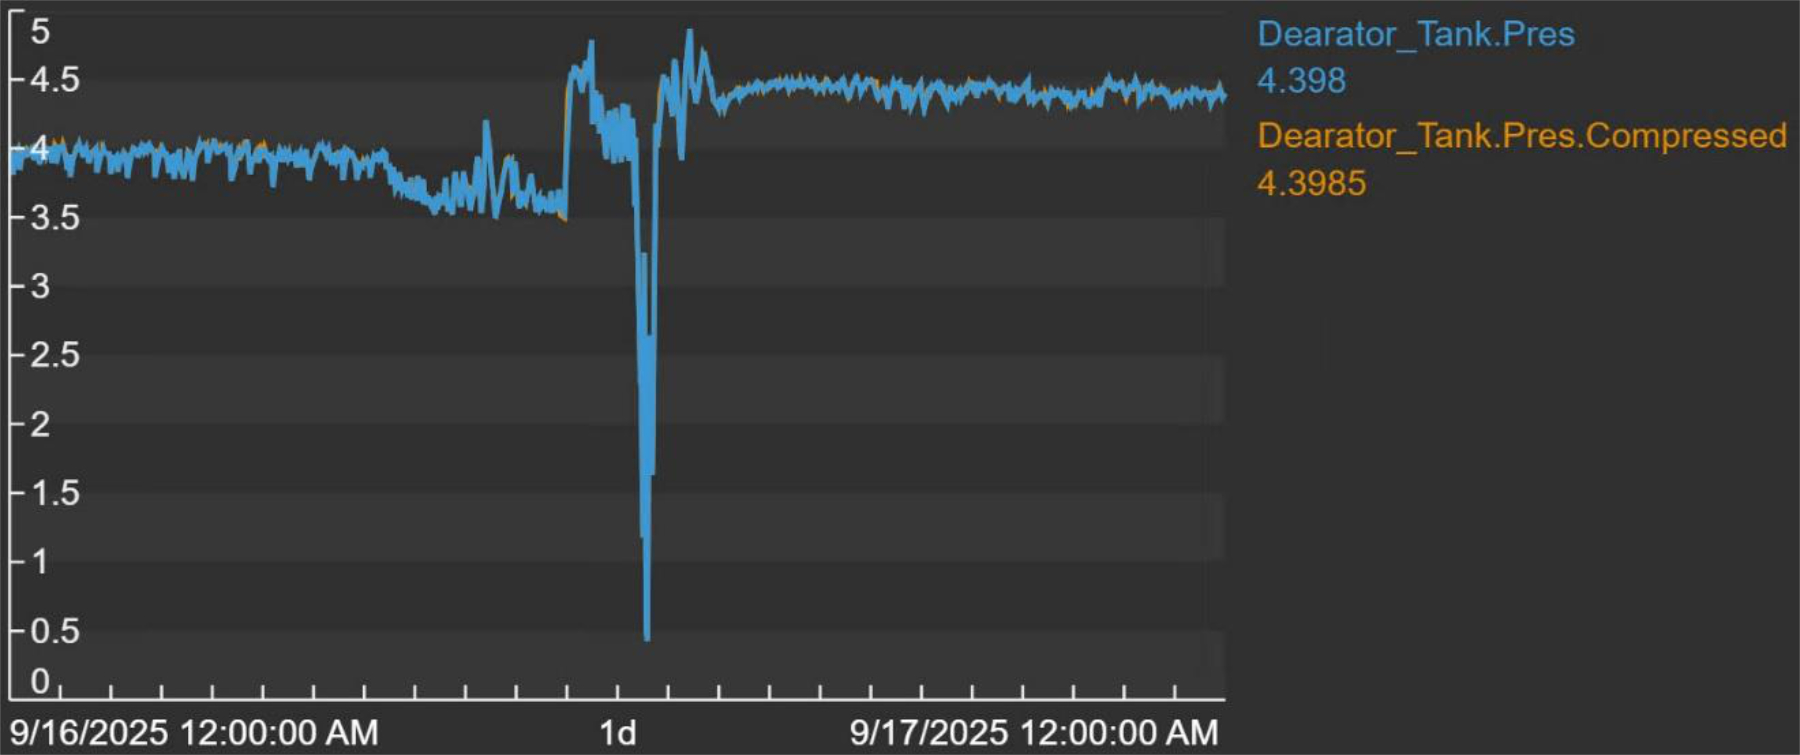
Below is the same comparison for a 1-day period — again imperceptible.
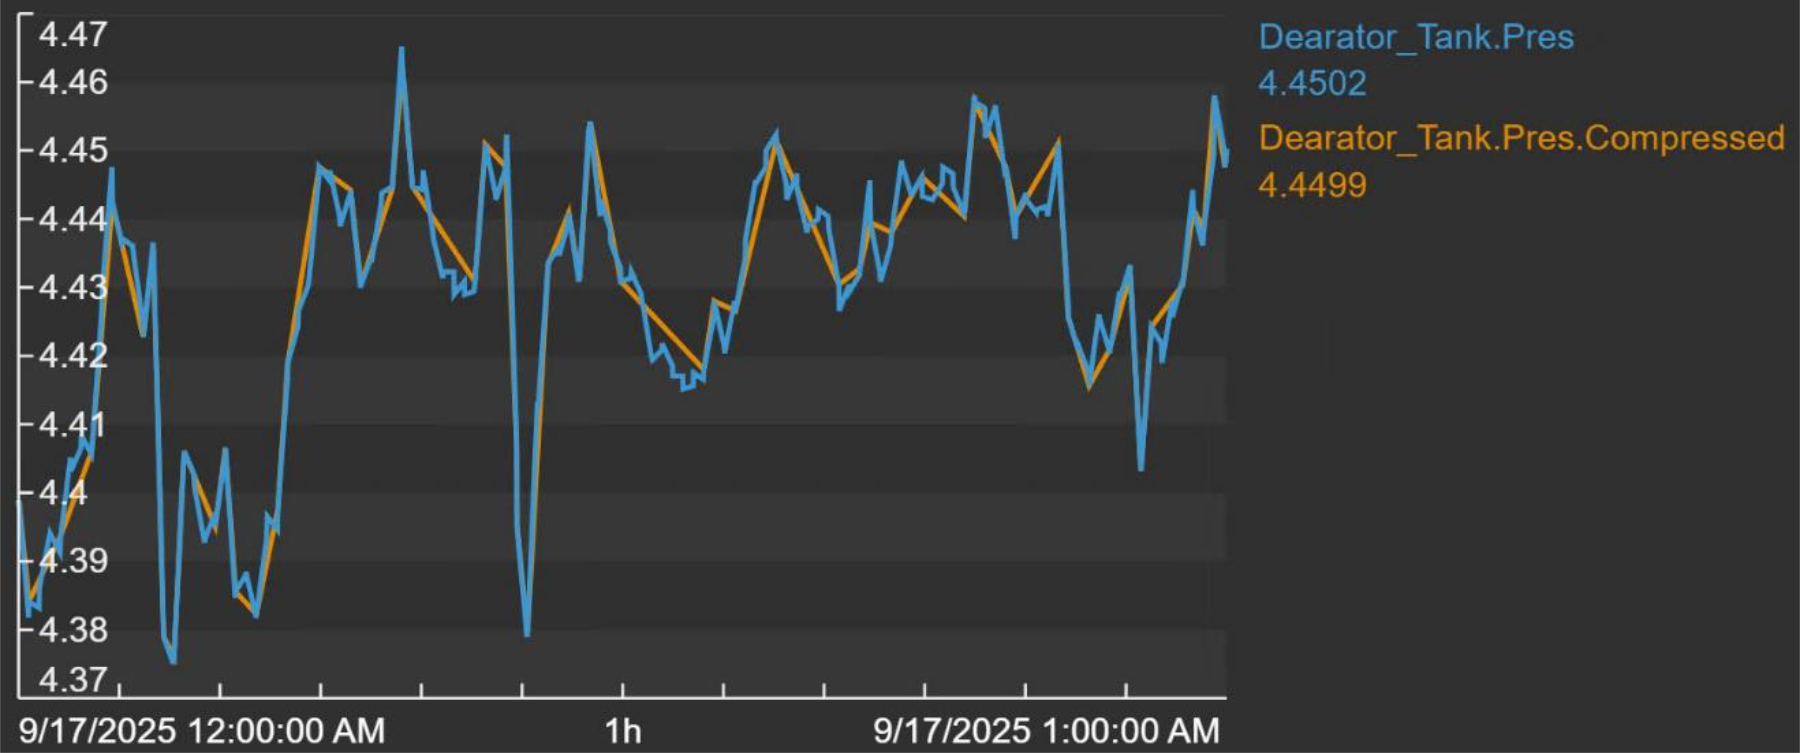
Below is the 1-hour period. You can see small differences, but note each horizontal band is 0.01 psi, the precision of the instrument.
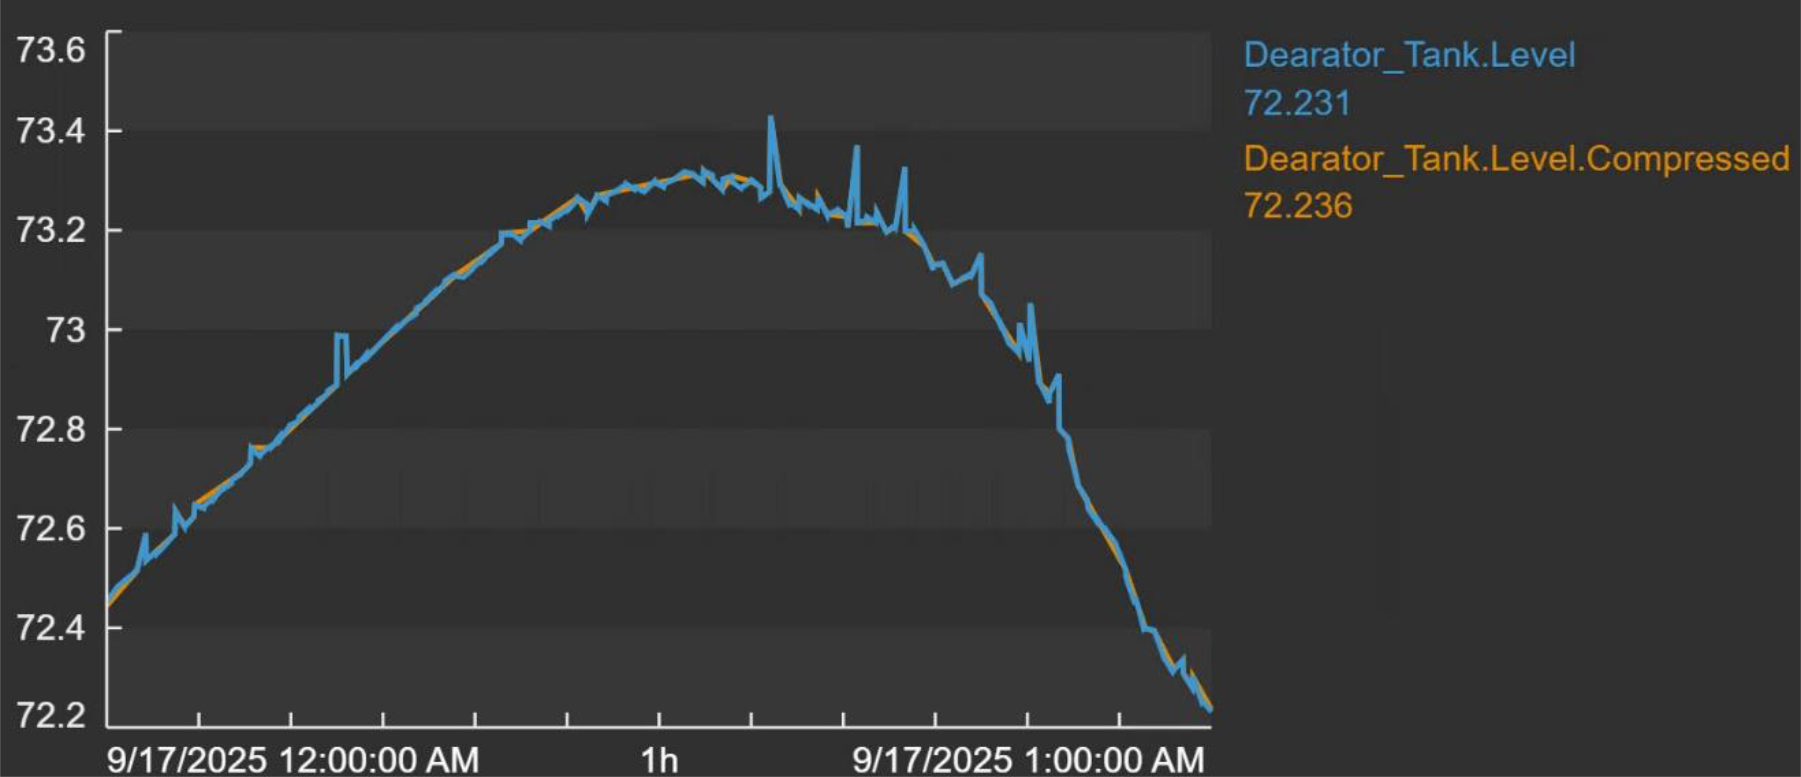
The maximum deviation from any raw value was 0.02 ft, well below the instrument precision of 0.0208 ft (1/4 in). The resulting compressed data is only 38.5% of the raw data.
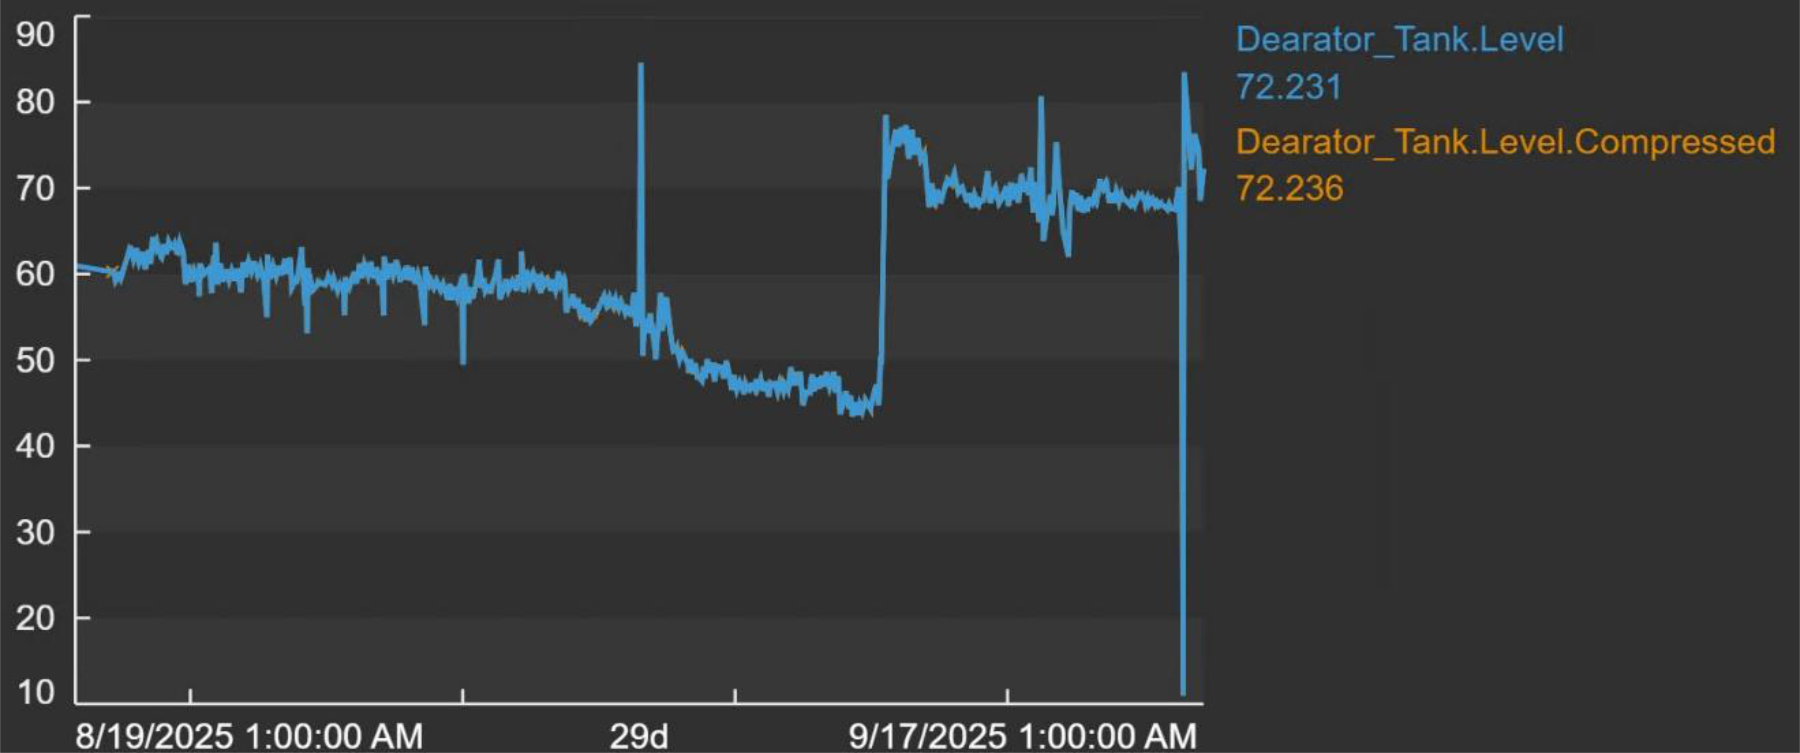
Raw vs compressed for the 29-day period.
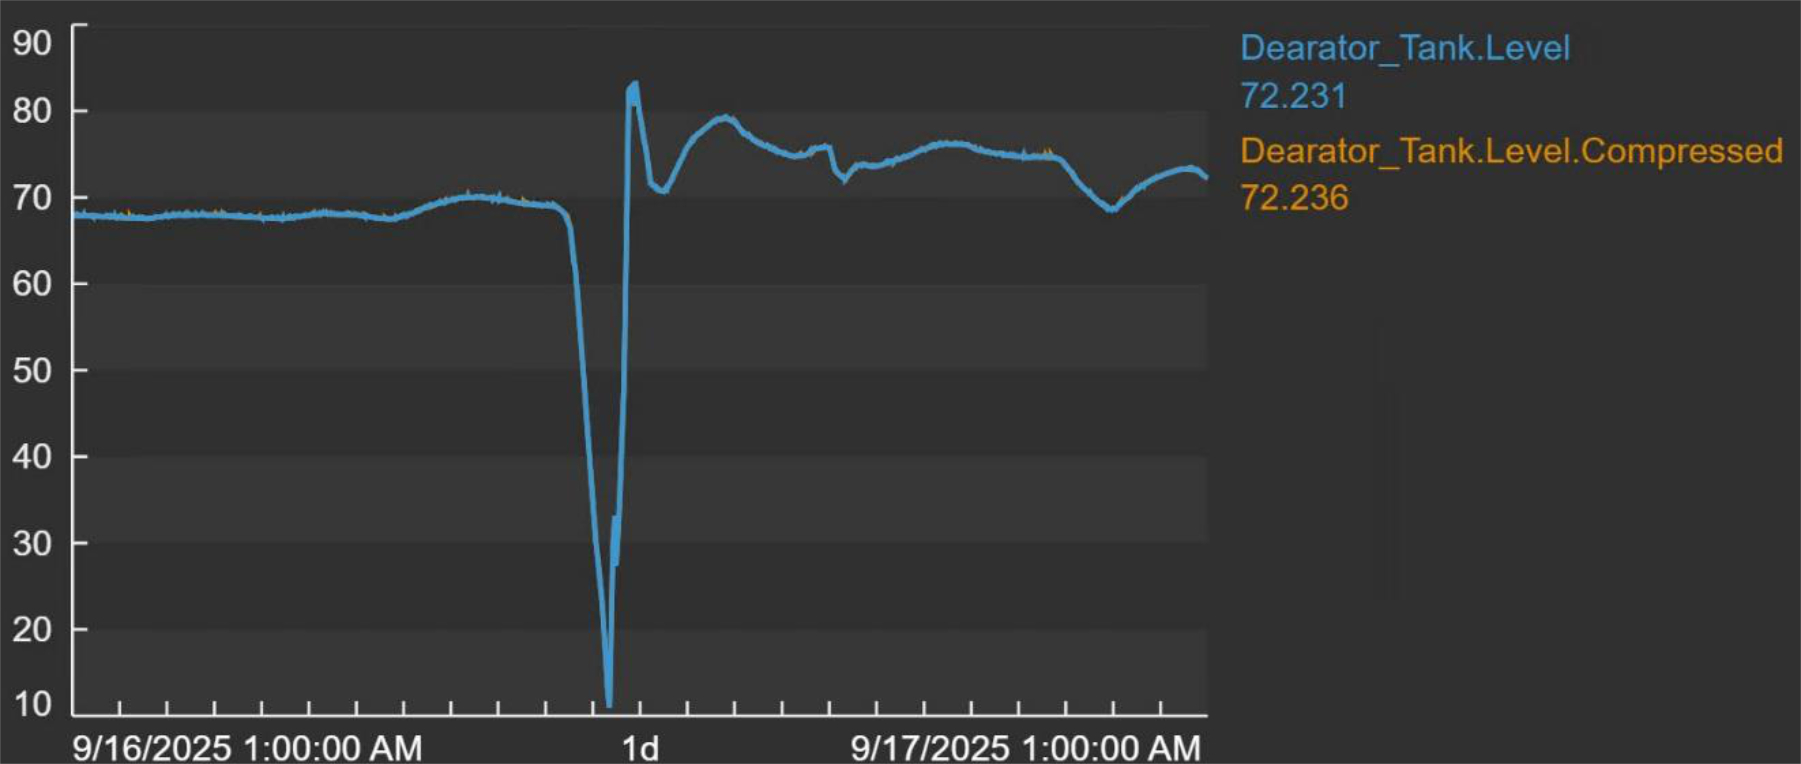
Raw vs compressed for the 1-day period — imperceptible.
Raw vs compressed for the 1-hour period — negligible differences.
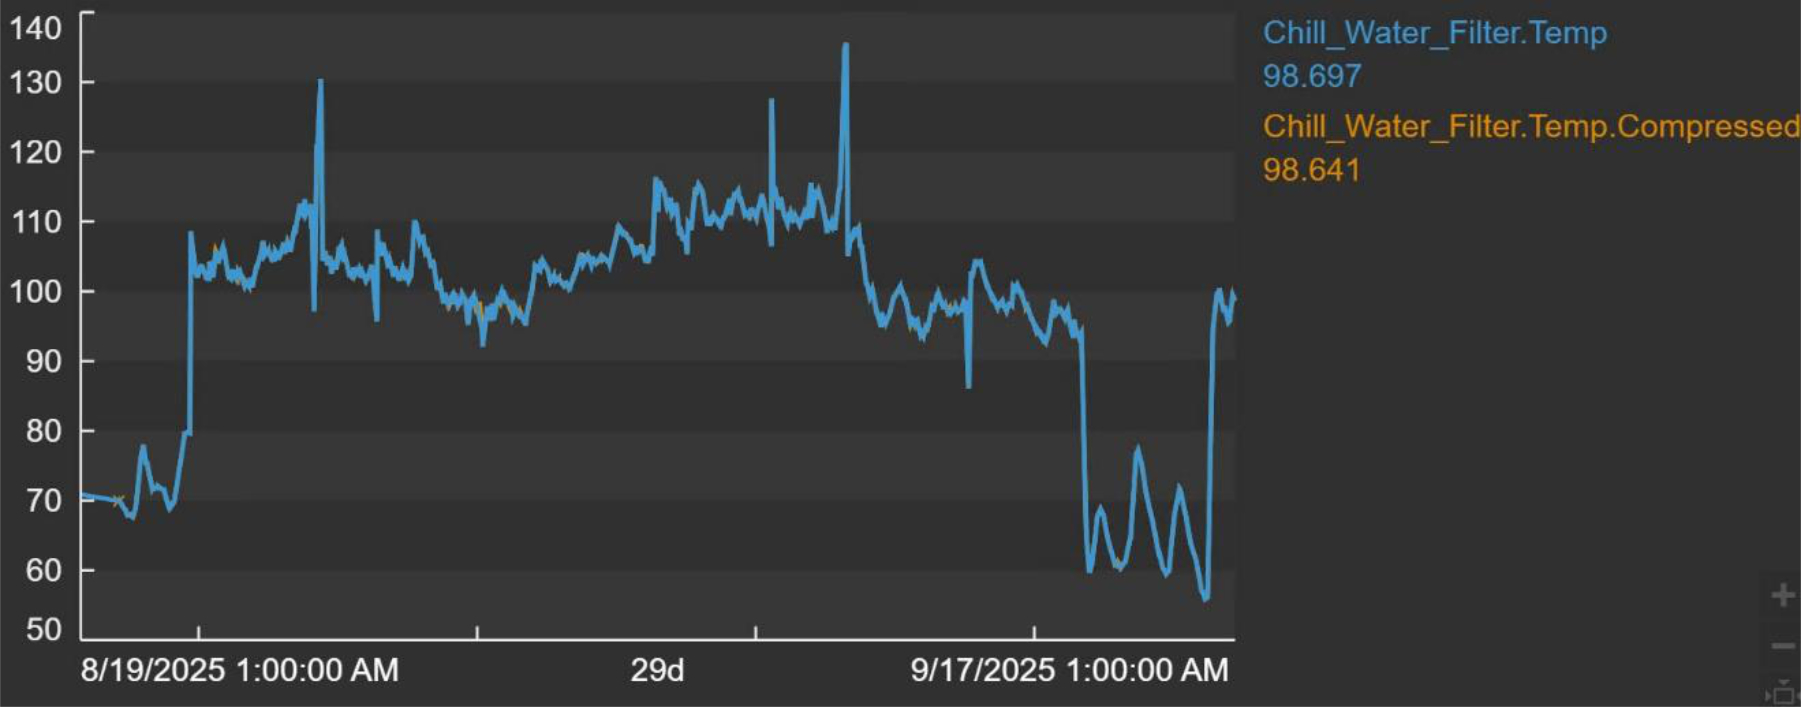
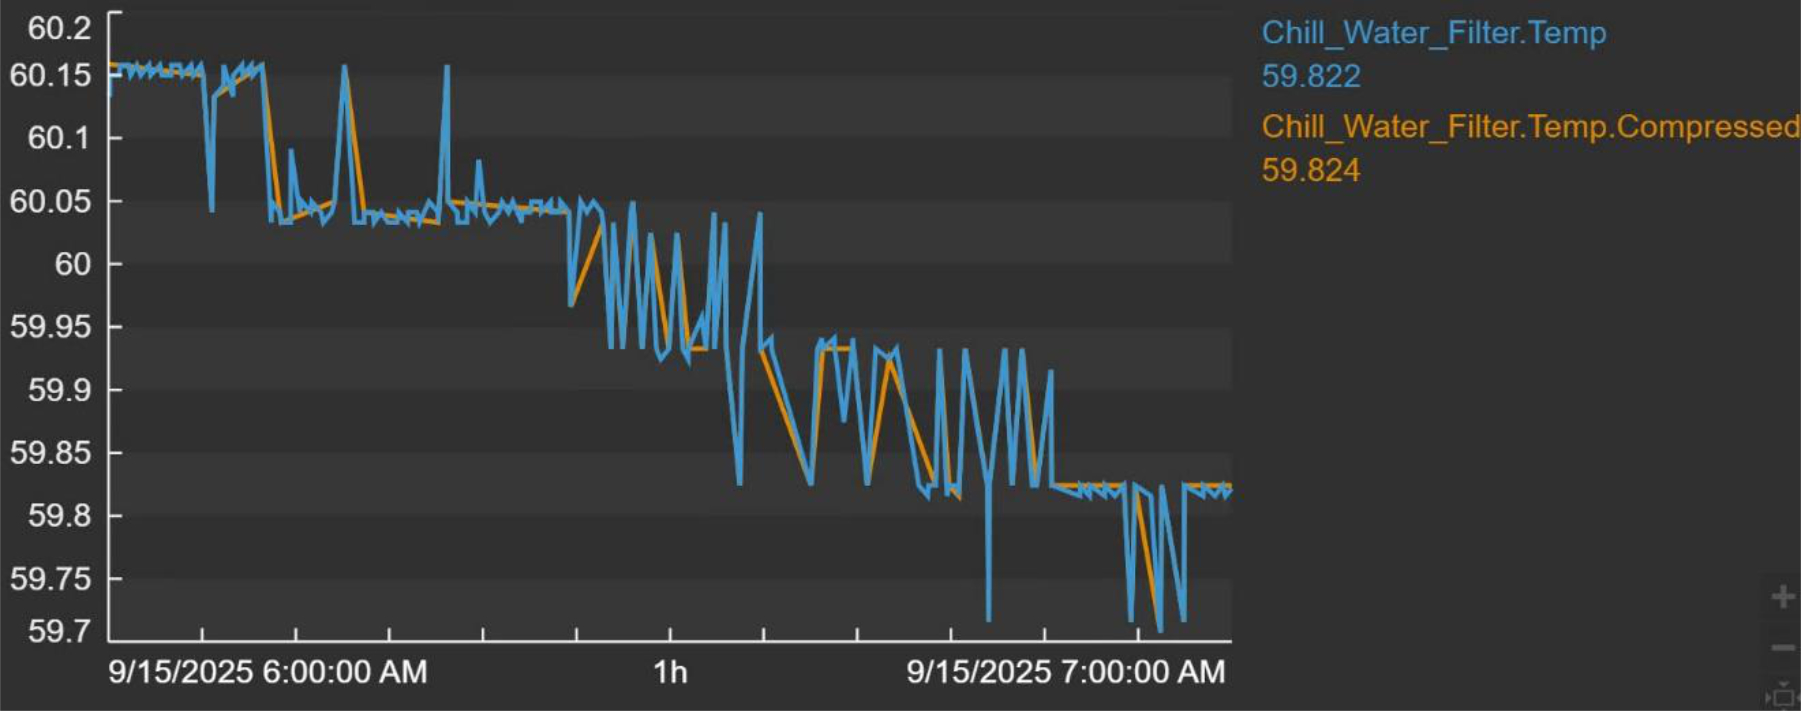
The maximum deviation from any raw value was 0.07 °F, well below the instrument precision of 0.1 °F. The resulting compressed data is only 27% of the raw data.
Raw vs compressed for the 29-day period.
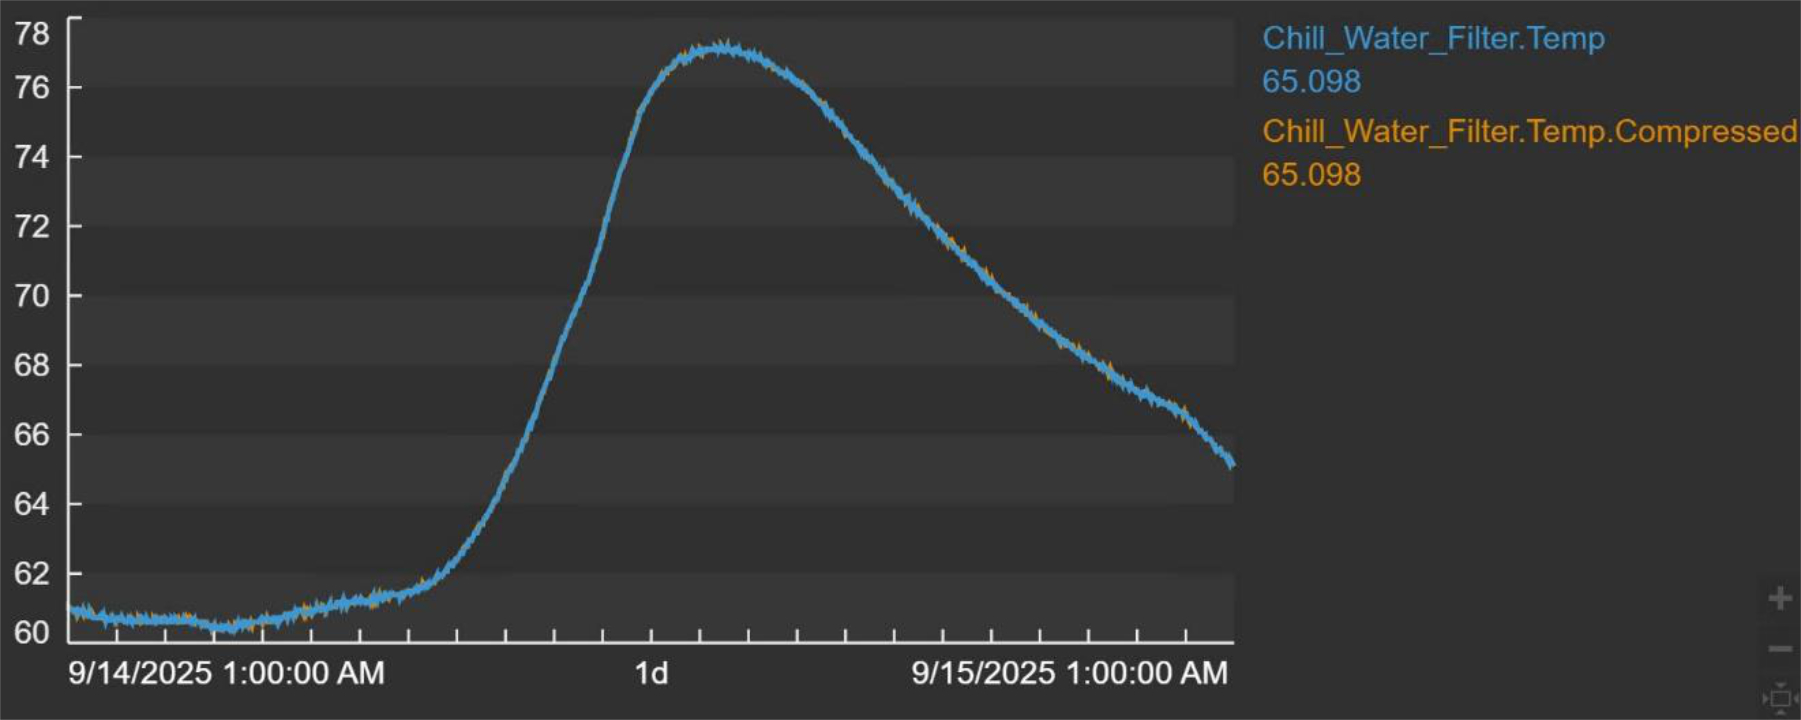
Raw vs compressed for the 1-day period — imperceptible.
Raw vs compressed for the 1-hour period. Each horizontal band represents half the precision of the instrument.
Talk to our team about a tailored AF assessment.